


We’re making the infographics and charts from this issue of the ReThink Quarterly available for anyone to use in their own presentations and reports.
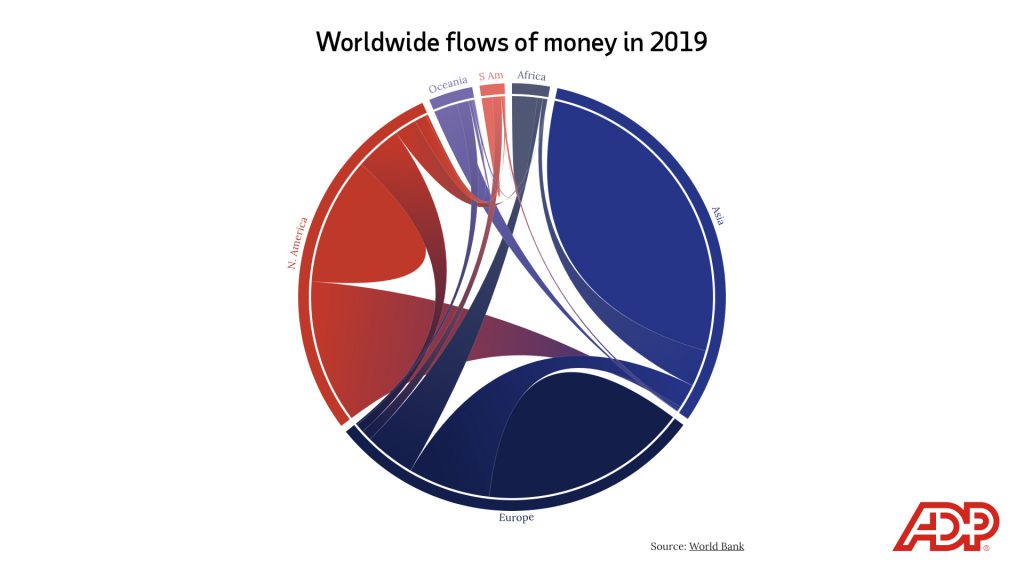
In 2020, about 281 million people lived in a country other than the one in which they were born, and those migrants send home hundreds of billions of dollars annually in the form of remittances.
Embed this visualization
<div class="flourish-embed flourish-chord" data-src="visualisation/5000803"><script src="https://public.flourish.studio/resources/embed.js"></script></div>
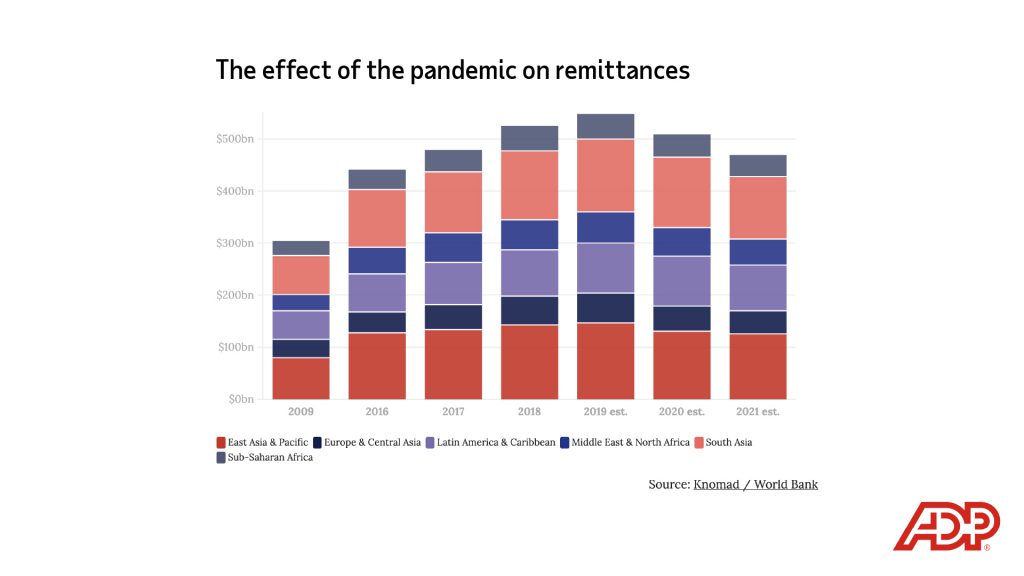
The World Bank estimated the pandemic and recession would cut those flows by about 7% in 2020 and again by 7% by the end of 2021.
Embed this visualization
<div class="flourish-embed flourish-chart" data-src="visualisation/5003214"><script src="https://public.flourish.studio/resources/embed.js"></script></div>
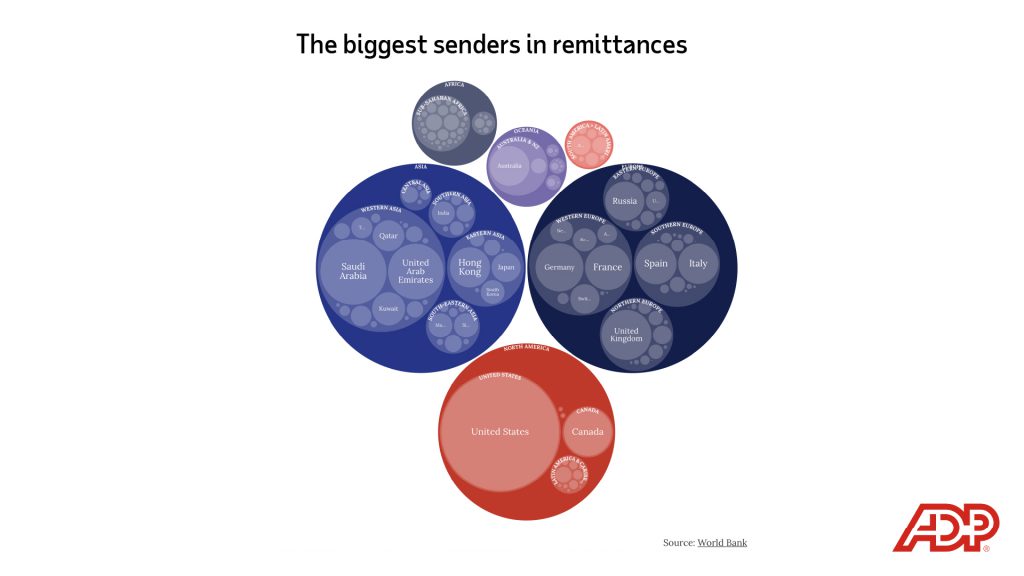
A visualization of the $717 billion sent home by migrants in 2019, organized by sender and receiver countries.
Embed this visualization
<div class="flourish-embed flourish-hierarchy" data-src="visualisation/5077721"><script src="https://public.flourish.studio/resources/embed.js"></script></div>
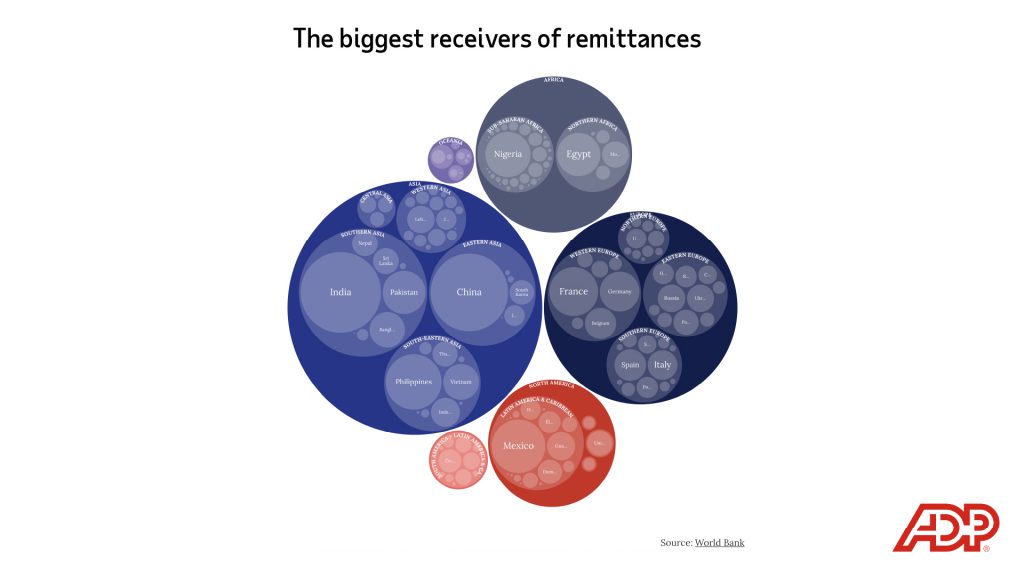
A visualization of the $717 billion sent home by migrants in 2019, organized by sender and receiver countries.
Embed this visualization
<div class="flourish-embed flourish-hierarchy" data-src="visualisation/5077721"><script src="https://public.flourish.studio/resources/embed.js"></script></div>

The changes in flows of remittances reflect the geopolitical changes in the world, as seen here between 1990 and 2020.
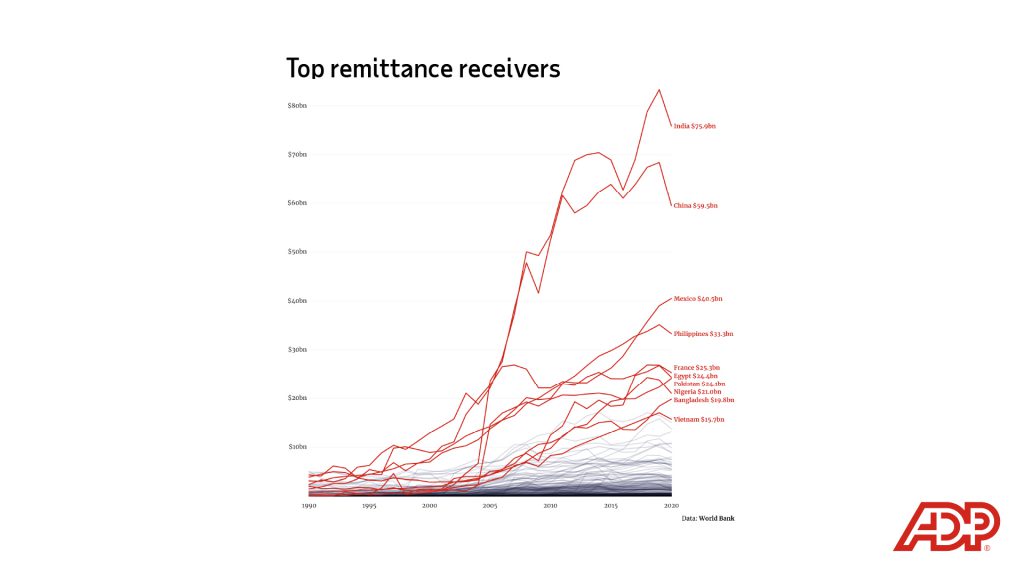
The changes in flows of remittances reflect the geopolitical changes in the world, as seen here between 1990 and 2020.
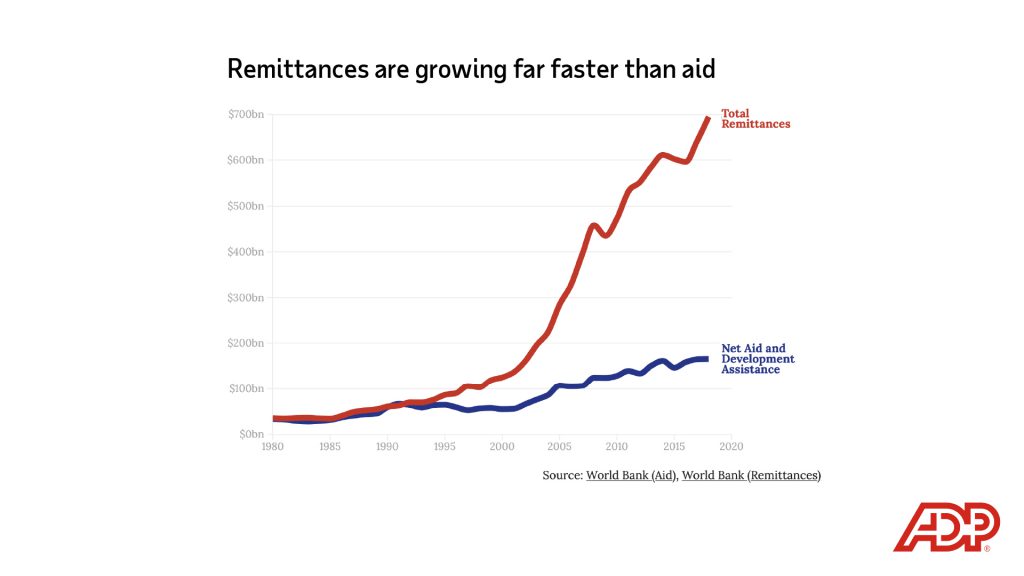
Remittances are often vitally important to recipient countries, and in total have outpaced international development aid since the 1990s.
Embed this visualization
<div class="flourish-embed flourish-chart" data-src="visualisation/5002827"><script src="https://public.flourish.studio/resources/embed.js"></script></div>
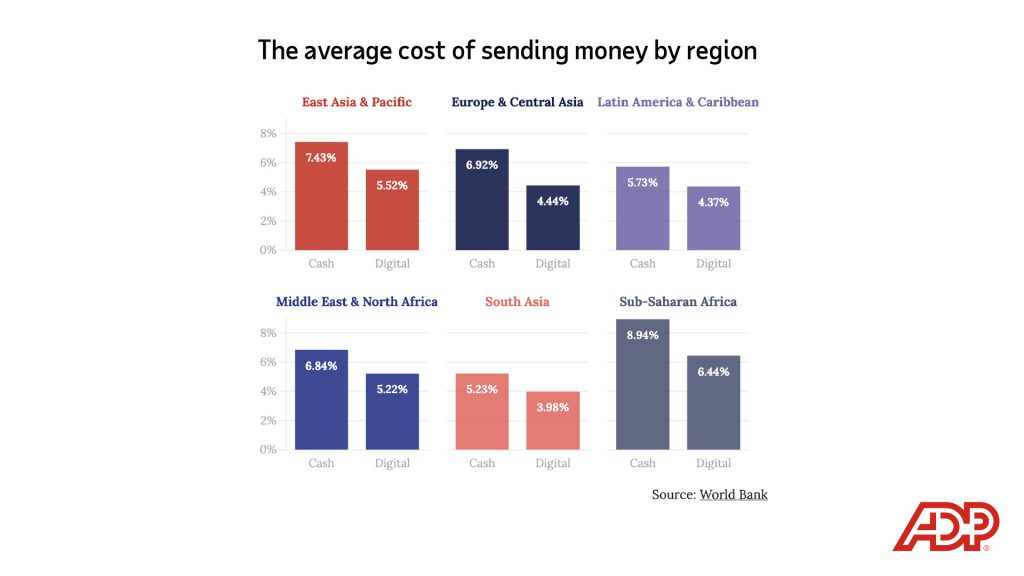
World Bank data shows that there’s a big difference in cost between sending cash and sending remittances digitally.
Embed this visualization
<div class="flourish-embed flourish-chart" data-src="visualisation/5086177"><script src="https://public.flourish.studio/resources/embed.js"></script></div>
Sign up to keep up to date with ReThink Q.