


We’re making the infographics and charts from this issue of the ReThink Quarterly available for anyone to use in their own presentations and reports.
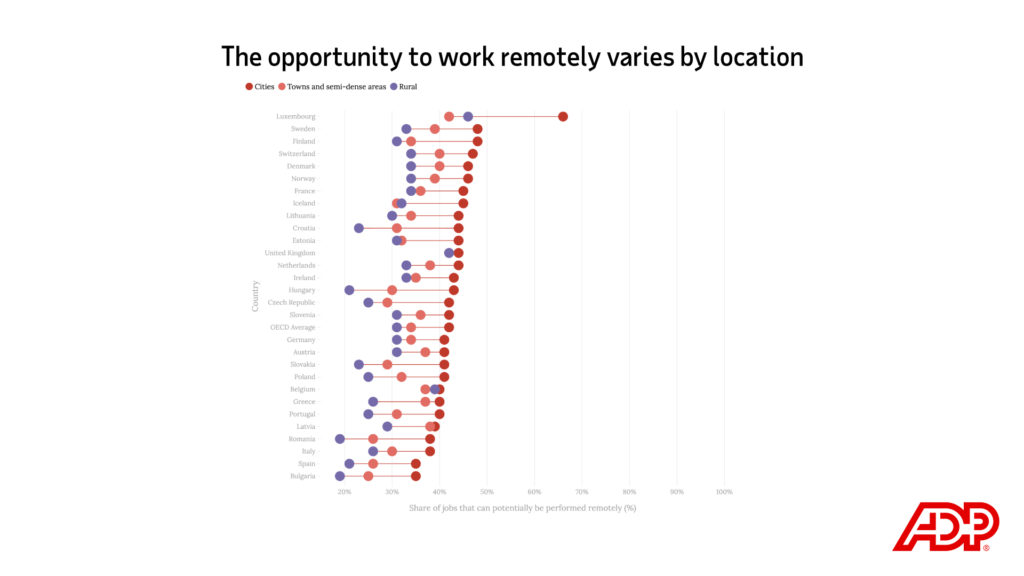
The OECD found that the opportunity to work remotely varies widely by country and whether a job’s location is urban, rural or in-between. For OECD countries overall, the share of urban jobs that can be done remotely is 42%, while just 34% of jobs in towns and 31% of rural jobs can be done remotely
Embed this visualization
<div class="flourish-embed flourish-scatter" data-src="visualisation/7330012" data-height="970px"><script src="https://public.flourish.studio/resources/embed.js"></script></div>
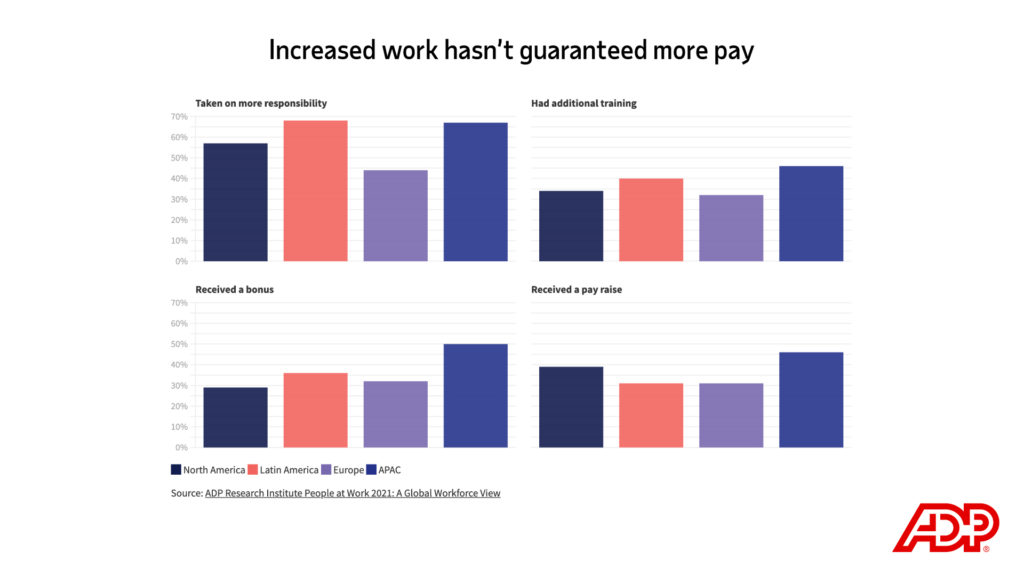
The ADP Research Institute’s People at Work 2021 report reveals about 46% of employees took on additional tasks or changed roles at work because of Covid-19. But not all workers were compensated for their additional efforts.
Embed this visualization
<div class="flourish-embed flourish-chart" data-src="visualisation/7203553"><script src="https://public.flourish.studio/resources/embed.js"></script></div>
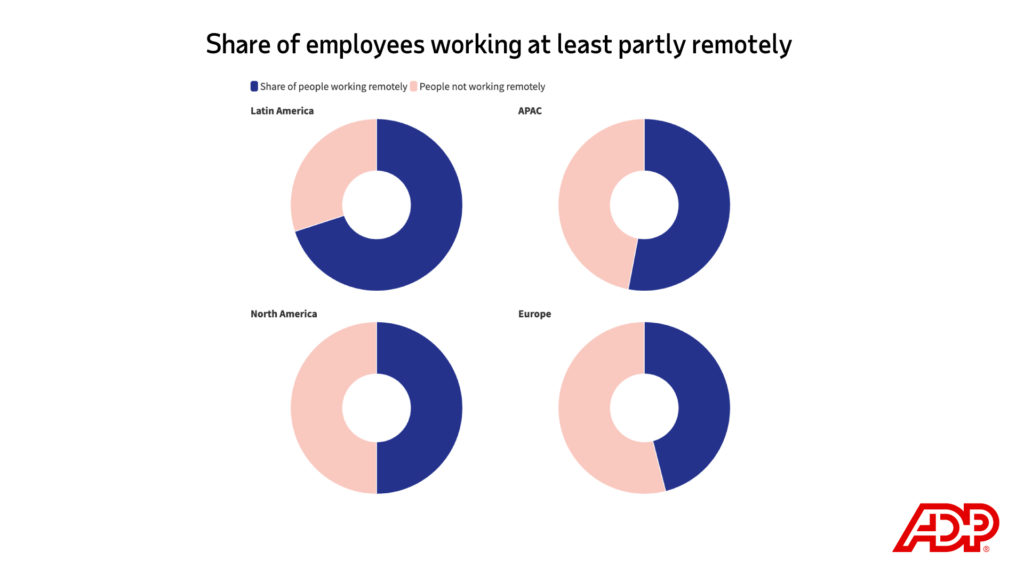
According to the ADP Research Institute, more than half of employees worldwide were working remotely or in a hybrid arrangement at the end of 2020.
Embed this visualization
<div class="flourish-embed flourish-chart" data-src="visualisation/7444233"><script src="https://public.flourish.studio/resources/embed.js"></script></div>

The usual metrics for measuring economic crisis impact, like unemployment rates, fall short in the pandemic. Analyzing the impact in terms of reduced work hours helps us better understand how the economic impact varies by place. In 2020, the biggest decreases in hours worked occurred in high-income countries.
Embed this visualization
<div class="flourish-embed flourish-slope" data-src="visualisation/7372212"><script src="https://public.flourish.studio/resources/embed.js"></script></div>
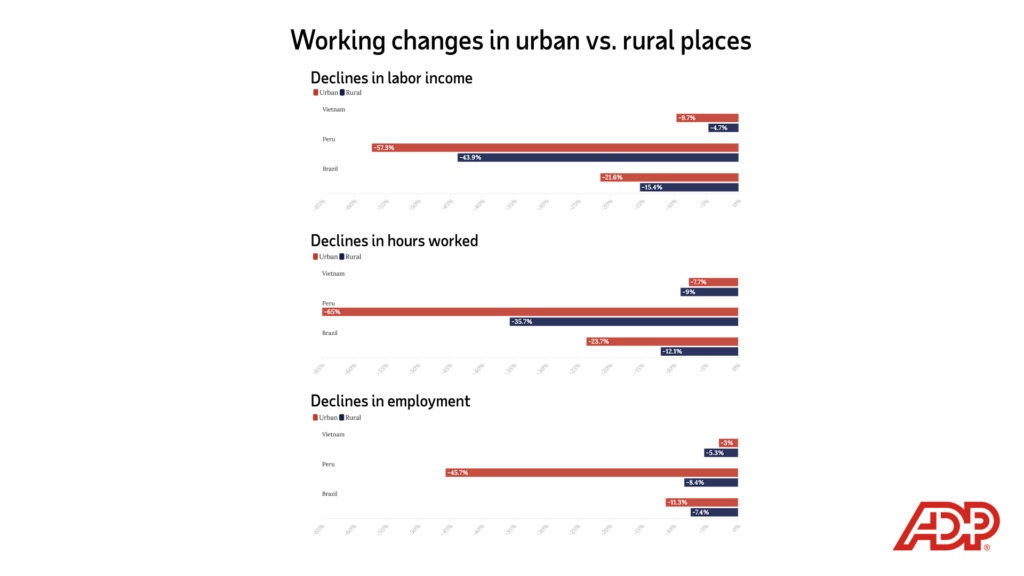
While tracking changes in labor income, hours worked and overall employment, the International Labor Organization found that people living in rural areas were generally less affected than those in urban areas. These infographics show how work decreased in urban and rural places in Peru and Brazil between the first and second quarters of 2020, and in Vietnam between the second quarters of 2019 and 2020:
Embed this visualization
<div class="flourish-embed flourish-slope" data-src="visualisation/7540111"><script src="https://public.flourish.studio/resources/embed.js"></script></div>

<div class="flourish-embed flourish-slope" data-src="visualisation/7540256"><script src="https://public.flourish.studio/resources/embed.js"></script></div>

<div class="flourish-embed flourish-slope" data-src="visualisation/7540267"><script src="https://public.flourish.studio/resources/embed.js"></script></div>
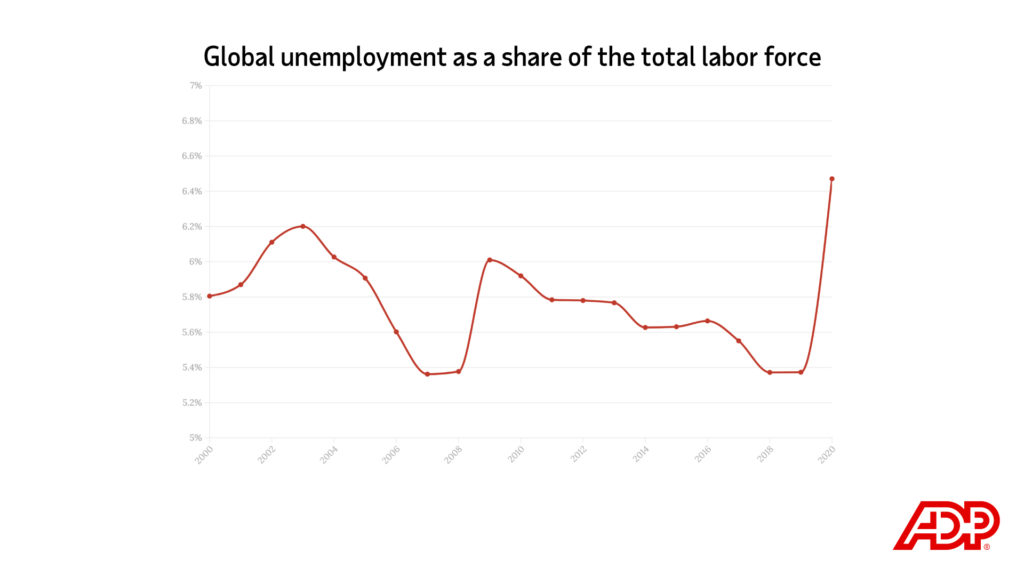
The global unemployment rate, according to the ILO, is projected to settle at 5.7% in 2022 — better than during the height of the pandemic, but still substantially higher than before. Economists anticipate the global economy to partly rebound in 2021 and 2022.
Embed this visualization
<div class="flourish-embed flourish-slope" data-src="visualisation/7343182"><script src="https://public.flourish.studio/resources/embed.js"></script></div>
Sign up to keep up to date with ReThink Q.