


We’re making the infographics and charts from this issue of the ReThink Quarterly available for anyone to use in their own presentations and reports.
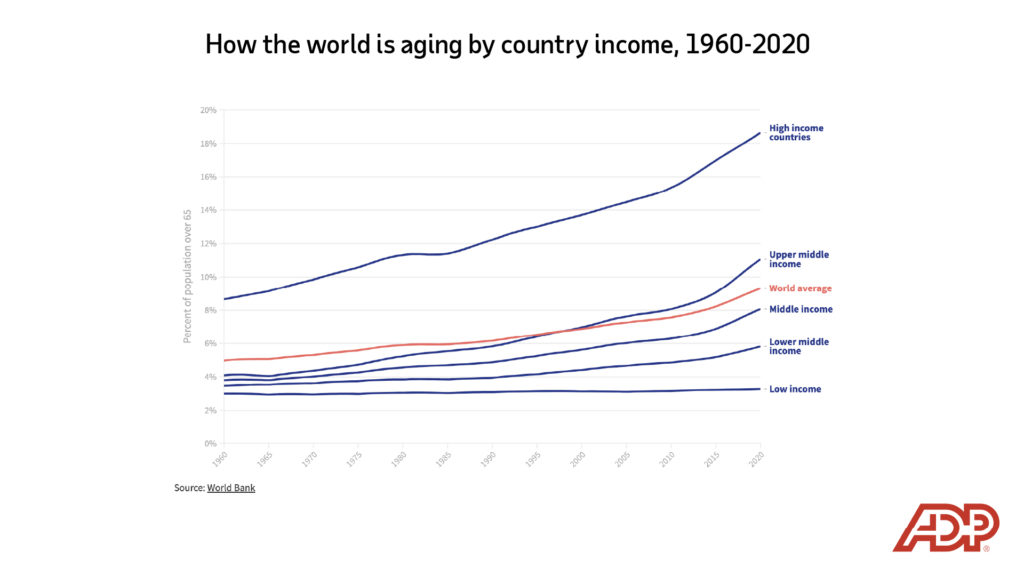
The wealth of a country is a key indicator of longevity, and high-income countries have the largest populations of people over age 65.
Embed this visualization
<div class="flourish-embed flourish-chart" data-src="visualisation/7982768"><script src="https://public.flourish.studio/resources/embed.js"></script></div>
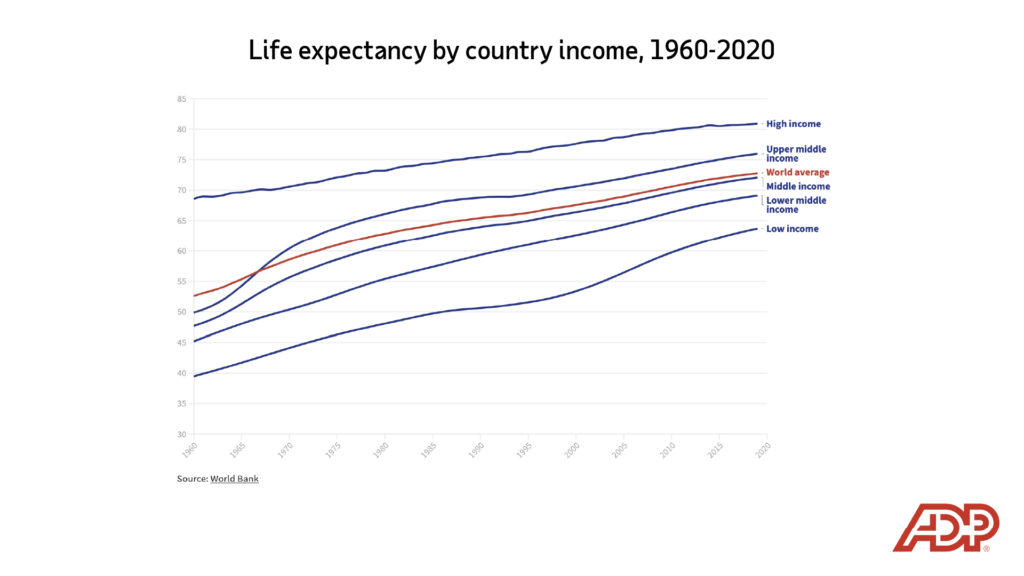
The gap in life expectancy between poor and rich countries has narrowed in the past 60 years — from 29 years in 1960 to just 17 years in 2020.
Embed this visualization
<div class="flourish-embed flourish-chart" data-src="visualisation/7983306"><script src="https://public.flourish.studio/resources/embed.js"></script></div>
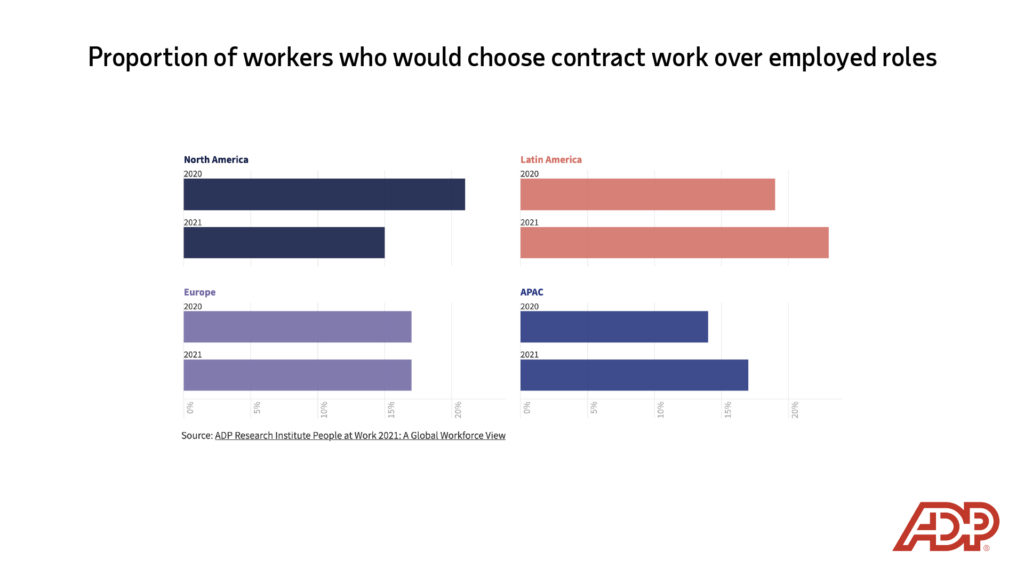
During the pandemic, the share of workers who say they’d choose a contract job over regular employment rose in some parts of the world.
Embed this visualization
<div class="flourish-embed flourish-chart" data-src="visualisation/8130232"><script src="https://public.flourish.studio/resources/embed.js"></script></div>
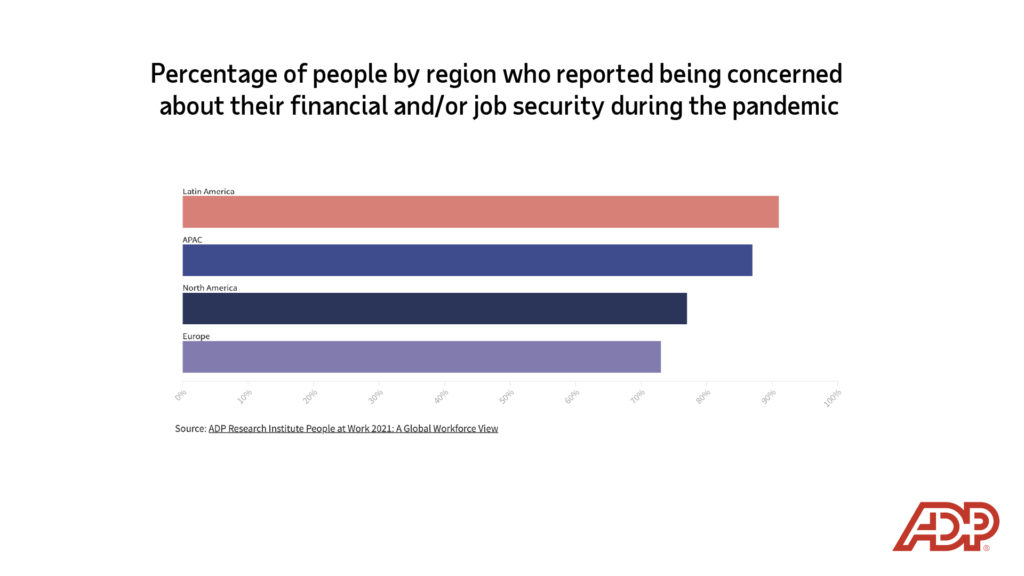
Many pandemic worries are caused by uncertainty about work and income.
Embed this visualization
<div class="flourish-embed flourish-chart" data-src="visualisation/8089174"><script src="https://public.flourish.studio/resources/embed.js"></script></div>
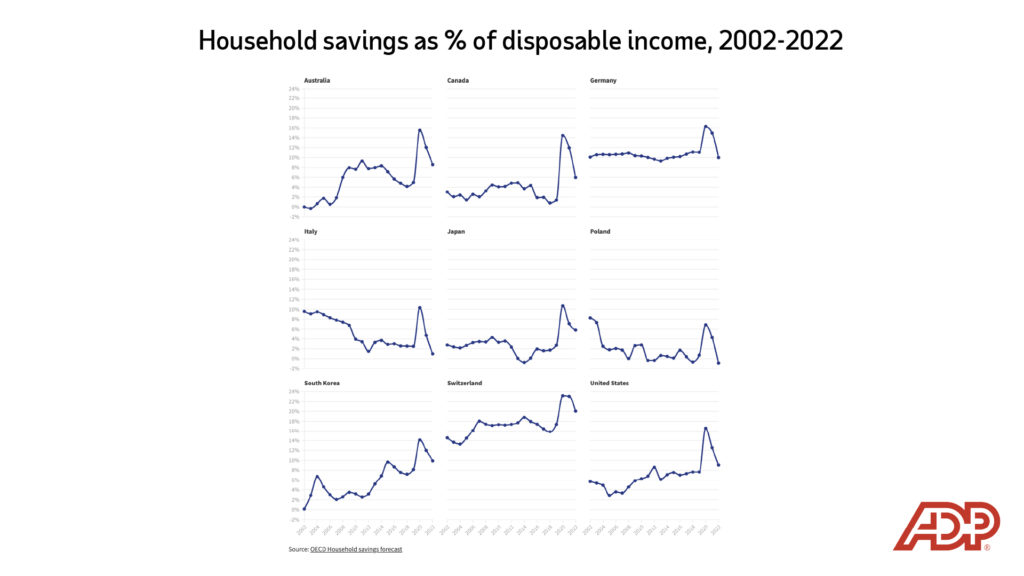
Household savings rates spiked during 2020, likely because of coronavirus assistance initiatives, but are projected to sink again in 2022.
Embed this visualization
<div class="flourish-embed flourish-chart" data-src="visualisation/8393431"><script src="https://public.flourish.studio/resources/embed.js"></script></div>
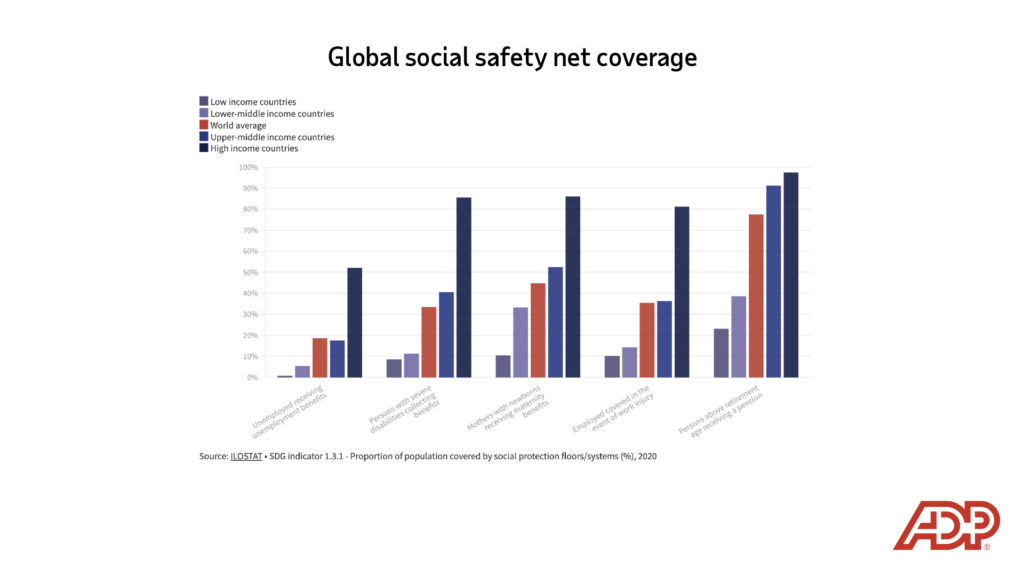
The proportions of people covered by government social safety nets is highest in high-income countries, as one might expect. But coverage drops dramatically even for upper-middle income countries.
Embed this visualization
<div class="flourish-embed flourish-chart" data-src="visualisation/8317658"><script src="https://public.flourish.studio/resources/embed.js"></script></div>
Sign up to keep up to date with ReThink Q.